Purpose and Benefits
The Trends Tab allows the user to view Observations for a patient across visits. The observations displayed in this tab can be configured.
| Note |
|---|
The Trends tab is "just-another-tab" on the Patient Dashboard, with name as Trends. One can name it anything, and use chart related display controls to create this dashboard. |
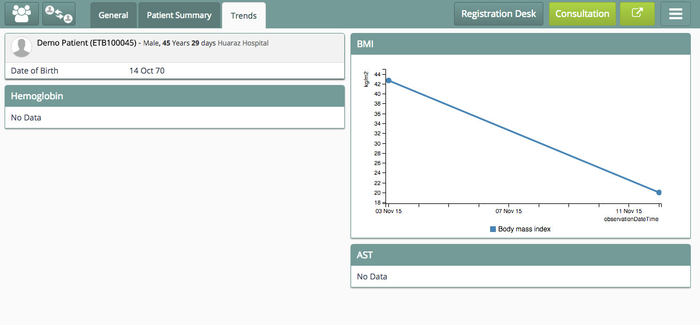
Trends Tab
Steps
1. Display Trends/Graphs tab
To configure or discard Trends/Graphs tab refer to the configuration snippet below:
| Code Block | ||||||||
|---|---|---|---|---|---|---|---|---|
| ||||||||
"trends": {
        "displayByDefault": true,
        "maxRecentlyViewedPatients": 10,
        "sections": {
            "patientInformation": {
                "type": "patientInformation",
                "patientAttributes": [],
                "addressFields": [],
                "displayOrder": 0,
                "translationKey": "DASHBOARD_TITLE_PATIENT_INFORMATION_KEY"
            }
}, |
| Info | ||
|---|---|---|
| ||
https://github.com/Bhamni/default-config/blob/master/openmrs/apps/clinical/dashboard.json |
2. Add Observations to Trends Tab
To configure Observations to be displayed in the tab refer to the configuration snippet below:
| Code Block | ||||||||
|---|---|---|---|---|---|---|---|---|
| ||||||||
   "weight/BMI": {
                "type": "observationGraph",
                "config": {
                    "yAxisConcepts": [
                        "Body mass index"
                    ],
                    "xAxisConcept": "observationDateTime",
                    "numberOfVisits": 10
                },
                "displayOrder": 6,
                "title": "BMI"
            },
            "Lab, Hemoglobin test result": {
                "type": "observationGraph",
                "config": {
                    "yAxisConcepts": [
                        "lab, Hemoglobin test result"
                    ],
                    "xAxisConcept": "observationDateTime",
                    "numberOfVisits": 10
                },
                "displayOrder": 6,
                "title": "Hemoglobin"
            },
            "AST": {
                "type": "observationGraph",
                "config": {
                    "yAxisConcepts": [
                        "Lab, AST"
                    ],
                    "xAxisConcept": "observationDateTime",
                    "numberOfVisits": 10
                },
                "displayOrder": 8,
                "title": "AST"
            }
        },
        "translationKey": "DASHBOARD_TAB_TRENDS_KEY"
    }
} |
| Tip | ||
|---|---|---|
| ||
https://github.com/Bhamni/default-config/blob/master/openmrs/apps/clinical/dashboard.json |
| Tip | ||||
|---|---|---|---|---|
| ||||
|
| Panel | ||||||
|---|---|---|---|---|---|---|
| ||||||
| Panel | ||||||
|---|---|---|---|---|---|---|
| ||||||
| Panel | ||||||
|---|---|---|---|---|---|---|
| ||||||