About the Feature
When doctors use Bahmni to look at data for patients, it is very useful for them to look at certain observations as graphs or trends so that they can get an idea of how the patient in faring with the given treatment. This is clearly represented in the Trends tab in the clinical module.
Where is it Used?
The Trends dashboard is used by the doctors at the time of consultation to quickly refer to how the patient has been doing in the key areas over a period of time.
Benefits
- This information is conveyed quickly when the data is visualised as a graph instead of a table.
- Clinicians can also view growth charts and reference charts in Bahmni
- Examples of charts that are used at various hospitals are - for a diabetes patient the clinician can view the trend chart of their blood sugar levels over a period of time., for a TB patient the weight and BMI charts are used to see the trend over the period of the treatment.
- For babies, growth charts can also be setup and the clinicians can easily make out which percentile the baby is in.
Screenshot
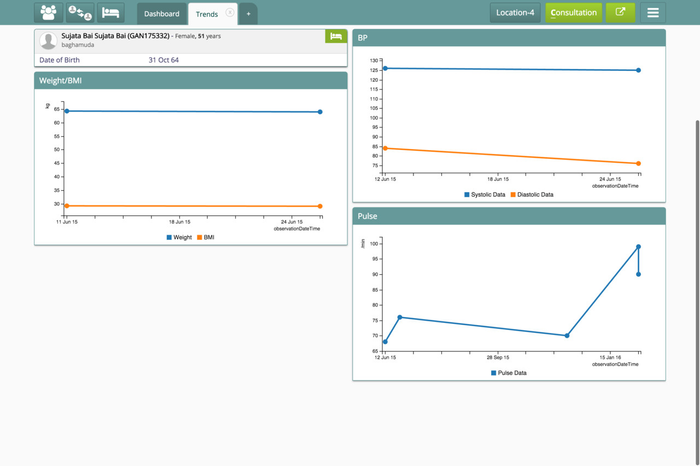
Trends page of a sample patient.
| Tip | ||||
|---|---|---|---|---|
| ||||
|
| Panel | ||||||
|---|---|---|---|---|---|---|
| ||||||
| Panel | ||||||
|---|---|---|---|---|---|---|
| ||||||