Purpose and Benefits
Bahmni supports auto-calculation of observations such as in forms. One can use this feature for calculated fields like BMI (Body Mass Index) and, Month Calculation for Chronic Treatment Chart. The calculated values can be shown across Bahmni. .
Refer to the screenshot below, where BMI and BMI values (Calculated Values) are shown in the Nutritional Values Display Control in the Patient Dashboard:
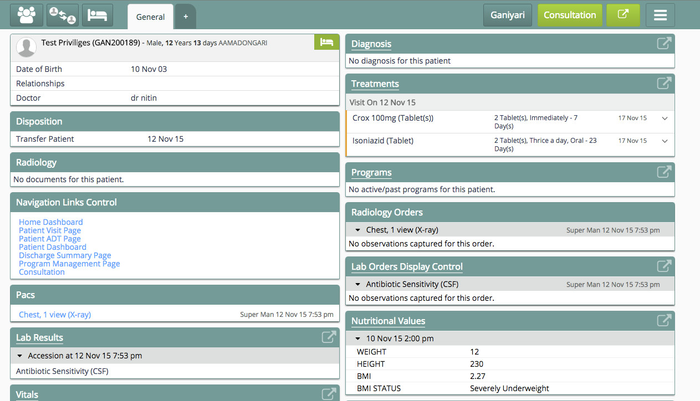
Patient Dashboard
Steps
Below are mentioned the steps to be followed for BMI calculation. These Similar steps can be used to create capture any other Auto-Calculated Values based on implementation specific needsobservations.
1) Setup the BMI Data concept in OpenMRS, as a container for BMI and BMI Abnormal concepts. Refer to the screenshot below:
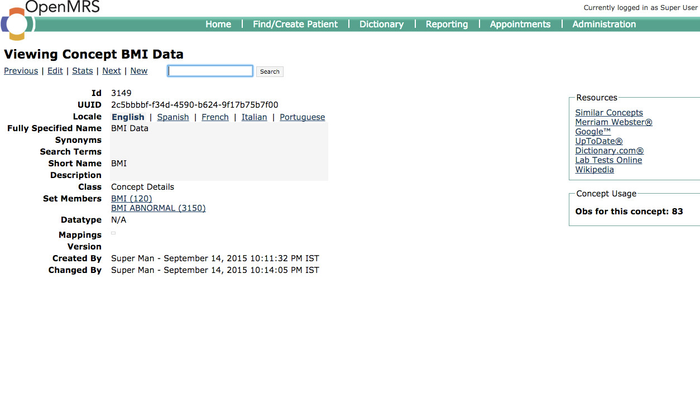 BMI Data Setup in OpenMRS
2) Setup BMI (For BMI Values) and BMI Status (For BMI Statuses such as Normal, Underweight, etc.) Concepts. Choose Class as "Computed" as these are Calculated Values. The screenshot below displays the BMI and BMI Status concepts setup in OpenMRS:
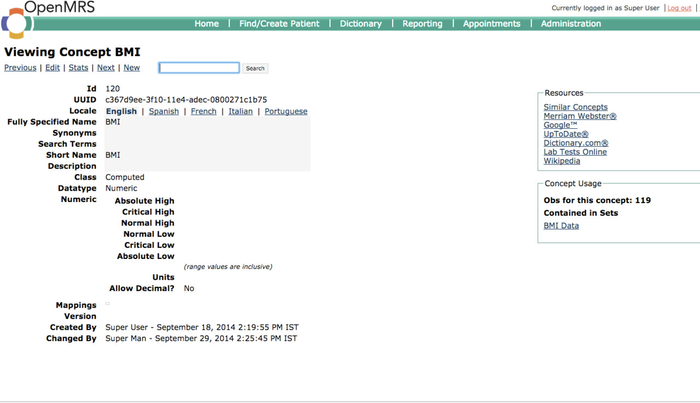 Setting up BMI Concept in OpenMRS
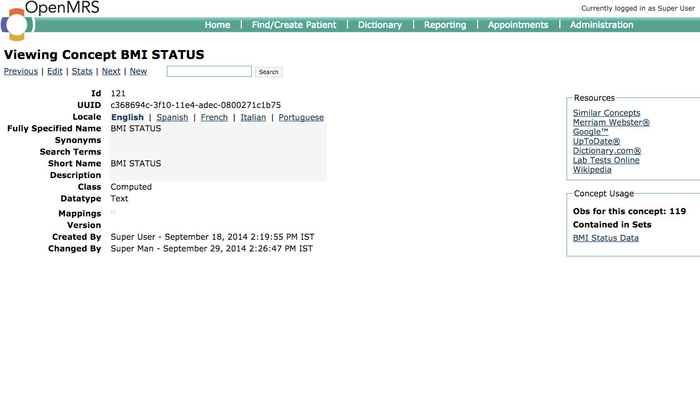 Setting up BMI Status Concept in OpenMRS
3) Configure Calculated Concepts as concept names in the dashboard.json config. Refer to the code snippet below:
| Code Block | ||||
|---|---|---|---|---|
| ||||
 "nutritionalValues": {
                "title":"Nutritional Values",
                "translationKey":"DASHBOARD_TITLE_NUTRITIONAL_VALUES_KEY",
                "name": "vitals",
                "isObservation": true,
                "displayOrder": 11,
                "dashboardParams": {
                    "conceptNames": [
                        "HEIGHT",
                        "Weight",
                        "BMI",
                        "BMI STATUS"
                    ],
                    "numberOfVisits": 2
}, |
Refer to https://github.com/Bahmni/default-config/blob/master/openmrs/apps/clinical/dashboard.json for further information.
4) For auto-calculation of BMI, the latest instance of Height and Weight will be calculated from the groovy script and validated by referencing them with the BMI_chart. For further information refer to https://github.com/Bahmni/default-config/tree/master/openmrs/obscalculator.
Here are sample groovy script and BMI charts: BMI_chart.csv BahmniObsValueCalculator.groovy
Key Fields
Displays the title of the section
translationKey
Indicates it's an observation display control (true)
displayOrder
dashboardParams
All configs applied to dashboard is put under this section
conceptNames
List of concept names to be seen on the section
numberOfVisits
| Tip | ||||
|---|---|---|---|---|
| ||||
|
| Panel | ||||||
|---|---|---|---|---|---|---|
| ||||||