Purpose
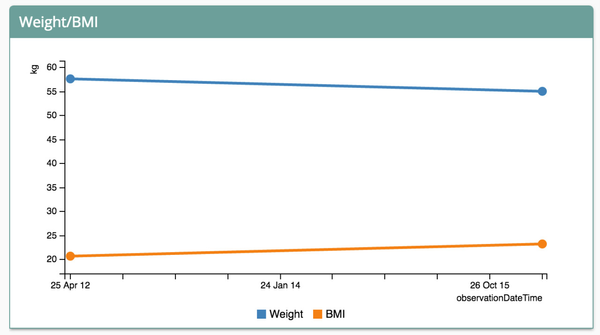
Observation Graph Control is configured to display the observations values as a graph against observation date time, age or any other concept for configured number of visits.
Screenshot
Configuration
Sample Config
Key Field Table
| Key | Info | Mandatory |
|---|---|---|
| type | The name/id for the control that needs to be picked from the code. | Y (in Visit Page) |
| title | Indicates the title that will be displayed on the dashboard/visit page for the section. | Y |
| yAxisConcepts | Array of concepts for which observations need to be plotted on the graph. | Y |
| xAxisConcepts | Concept on X Axis (observationDateTime, age or any concept). | Y |
| numberOfVisits | Specifies the number of visits for which data has to be displayed. | N |
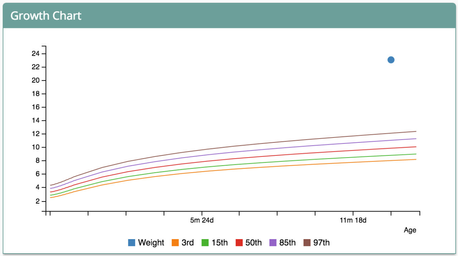
Graph With Reference Data Control
Graph Control Config becomes Chart With Reference Data Config with the addition of the 'referenceData' in the config section referring to the .csv file as shown below
Screenshot
Configuration
Sample Config
"growthChart": {
   "type": "observationGraph",
   "title": "Growth Chart",
   "config": {
      "yAxisConcepts": [ "Weight" ],
      "referenceData": "growthChartReference.csv",
      "numberOfVisits": 20
  }
}
Key Field Table
| Key | Info | Mandatory |
|---|---|---|
yAxisConcepts | It can be any Numeric Concept name. | Y |
referenceData | It would be name of the csv file to be loaded. | Y |
numberOfVisits | It is the number of visits for which data has to be displayed. | N |
Sample Reference Data CSV file
Gender, Age, Ref1, Ref2
M, 1, 10.5, 12.5
M, 2, 20.5, 22.5
F, 1, 9.5, 12
F, 2, 19.5, 22
In the example above:
- The first row is the header row.
- Age, Gender column name should always have 'Age', 'Gender' labels.
- Age, Gender columns are mandatory.
- Age is always assumed to be months (you can give decimals to represent days).
- Other columns will correspond to the each reference line.
On this Page