/
Configure Patient Graphs and Trends
Configure Patient Graphs and Trends
- Teresa Gracias
- Gurpreet Luthra
- Sravanthi N. S. CH.
Owned by Teresa Gracias
Last updated: Nov 20, 2022 by Gurpreet LuthraVersion comment
Purpose and Benefits
The Trends Tab allows the user to view Observations for a patient across visits. The observations displayed in this tab can be configured.
The Trends tab is "just-another-tab" on the Patient Dashboard, with name as Trends. One can name it anything, and use chart related display controls to create this dashboard.
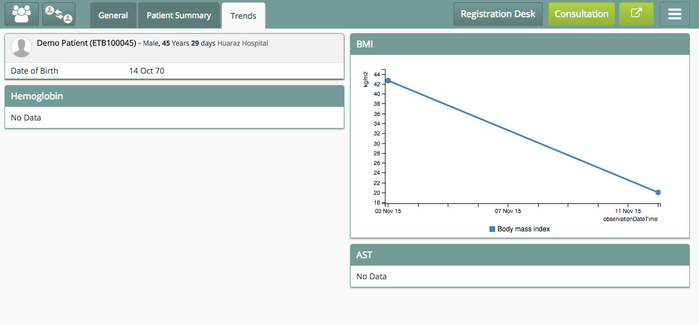
Trends Tab
Steps
1. Display Trends/Graphs tab
To configure or discard Trends/Graphs tab refer to the configuration snippet below:
Sample Configuration
"trends": {
        "displayByDefault": true,
        "maxRecentlyViewedPatients": 10,
        "sections": {
            "patientInformation": {
                "type": "patientInformation",
                "patientAttributes": [],
                "addressFields": [],
                "displayOrder": 0,
                "translationKey": "DASHBOARD_TITLE_PATIENT_INFORMATION_KEY"
            }
}
2. Add Observations to Trends Tab
To configure Observations to be displayed in the tab refer to the configuration snippet below:
Sample Configuration
   "weight/BMI": {
                "type": "observationGraph",
                "config": {
                    "yAxisConcepts": [
                        "Body mass index"
                    ],
                    "xAxisConcept": "observationDateTime",
                    "numberOfVisits": 10
                },
                "displayOrder": 6,
                "title": "BMI"
            },
            "Lab, Hemoglobin test result": {
                "type": "observationGraph",
                "config": {
                    "yAxisConcepts": [
                        "lab, Hemoglobin test result"
                    ],
                    "xAxisConcept": "observationDateTime",
                    "numberOfVisits": 10
                },
                "displayOrder": 6,
                "title": "Hemoglobin"
            },
            "AST": {
                "type": "observationGraph",
                "config": {
                    "yAxisConcepts": [
                        "Lab, AST"
                    ],
                    "xAxisConcept": "observationDateTime",
                    "numberOfVisits": 10
                },
                "displayOrder": 8,
                "title": "AST"
            }
        },
        "translationKey": "DASHBOARD_TAB_TRENDS_KEY"
    }
}
Feature Details
Usage Details
Related Links
, multiple selections available,
Related content
Patient Graphs and Trends
Patient Graphs and Trends
More like this
Configure Patient Dashboard
Configure Patient Dashboard
More like this
Patient Dashboard and Visit Page
Patient Dashboard and Visit Page
More like this
Configure Patient Registration
Configure Patient Registration
Read with this
Graph Control
Graph Control
More like this
Binding Drug Frequency with Treatment Chart
Binding Drug Frequency with Treatment Chart
Read with this
The Bahmni documentation is licensed under Creative Commons Attribution-ShareAlike 4.0 International (CC BY-SA 4.0)