Disease Template Control
- Teresa Gracias
- Gurpreet Luthra
- teresa gracias
Purpose
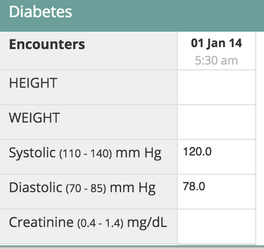
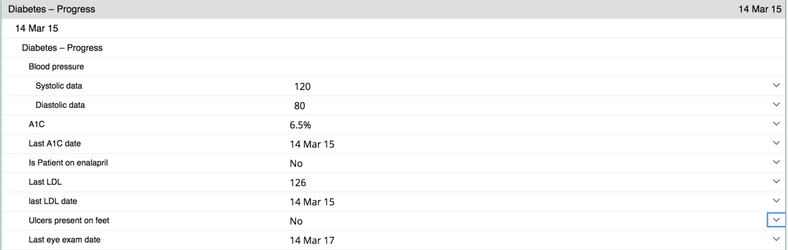
Disease Template Control can be configured to display all the observation values captured against the particular disease like Cancer, Diabetes or TB.
Screenshot
Sample Configuration
"diabetes":{
   "title":"Diabetes",
   "templateName":"Diabetes Templates",
   "type":"diseaseTemplate",
   "dashboardConfig":{
      "showOnly":[
      ],
      "showGroupDateTime":false
   },
   "expandedViewConfig":{
      "showOnly":[
      ],
      "showDetailsButton":true,
      "pivotTable":{
         "numberOfVisits":"15",
         "groupBy":"encounters",
         "obsConcepts":[
            "Weight",
            "Height",
            "Systolic",
            "Diastolic",
            "Diabetes, Foot Exam",
            "Diabetes, Eye Exam",
            "Diabetes, Diabetes, Complications"
         ],
         "drugConcepts":[
            "Ipratropium Pressurised",
            "Garbhpal Rasa",
            "Lente Insulin"
         ],
         "labConcepts":[  "RBS","FBS","PP2BS","Hb1AC"]
      },
      "observationGraph":{
         "type":"observationGraph",
         "title":"Temperature",
         "config":{
            "yAxisConcepts":[
               "Temperature"
            ],
            "numberOfVisits":3
         }
      }
   }
}
Key Field Table
| Key | Info | Mandatory |
|---|---|---|
| title | The title to be displayed on the dashboard/visit page for the section. | Y |
| templateName | The name of the disease template in openMRS that needs to be displayed. | Y |
| type | The name/id for the control that needs to be picked from the code. | Y |
| showOnly | The concept names of the concepts that need to be displayed in this section. If blank, then all the concepts in that disease template will be displayed. | N |
| pivotTable | The configuration for the pivot table/flowsheet | Y |
| observationGraph | The configuration for the observationGraph (OPTIONAL) | N |
| numberOfVisits | The number of visits for which data has to be displayed in the pivot table | N |
| groupBy | Can be encounters/visits. If grouped by the encounter, then the data is displayed per encounter in the pivot table. If grouped by the visit, then the latest value of the observations in each visit is displayed in the pivot table. | Y |
| obsConcepts | The concept names of the observations that need to be displayed in the pivot table | Y |
| drugConcepts | The concept names of the drugs that need to be displayed in the pivot table | Y |
| labConcepts | The concept names of the lab tests that need to be displayed in the pivot table | Y |
| dashboardConfig | Indicates the configuration for the dashboard | Y |
| expandedViewConfig | Indicates the configuration for the details page (All Disease Details Page) | Y |
| showDetailsButton | Configuration to display audit information when '+ ' sign is clicked. If set to false, the '+' button will not be displayed. | N |
| showGroupDateTime | Configuration to display grouped encounter date time. If set to false, it is hidden. Default value is true(which means it is treated as true, if nothing specified). Should be separately configured for both dashboard and allDetails page. | N |
On this Page
Related content
The Bahmni documentation is licensed under Creative Commons Attribution-ShareAlike 4.0 International (CC BY-SA 4.0)